Rebuilding Teams
I was chatting with my uncle recently about how well AFL teams perform after they go through a rebuild. This was a particularly sore point for him, as he felt his beloved Saints attempted such an exercise every three years.
He was very curious to know if and how much teams who had performed poorly over a three-year stretch (leading to a top 5 draft pick in each of these years) improved in the following three years. So, I went away and crunched the numbers, using an arbitrary value of winning less than 25% of regular season games to define a poor season.
For the purposes of this exercise, we can only look as far back as 1986, when the first modern AFL (or VFL, at that stage) draft was held. For the history buffs out there, the very first player selected in the 1986 draft was Martin Leslie from Port Adelaide in the SANFL. Leslie was picked by the Brisbane Bears.
Since 1986, there have been seven occasions where a team has gone three consecutive seasons where they won less than 25% of games and made a top 5 draft selection each year (1):
- Brisbane Bears (1991-1993)
- Sydney (1992-1994)
- Fitzroy (1994-1996)
- St Kilda (2000-2002)
- Carlton (2005-2007)
- Melbourne (2007-2009)
- Brisbane Lions (2015-2017)
The graph below shows the win percentage for these seven teams during the three “bad” years and the subsequent three years.
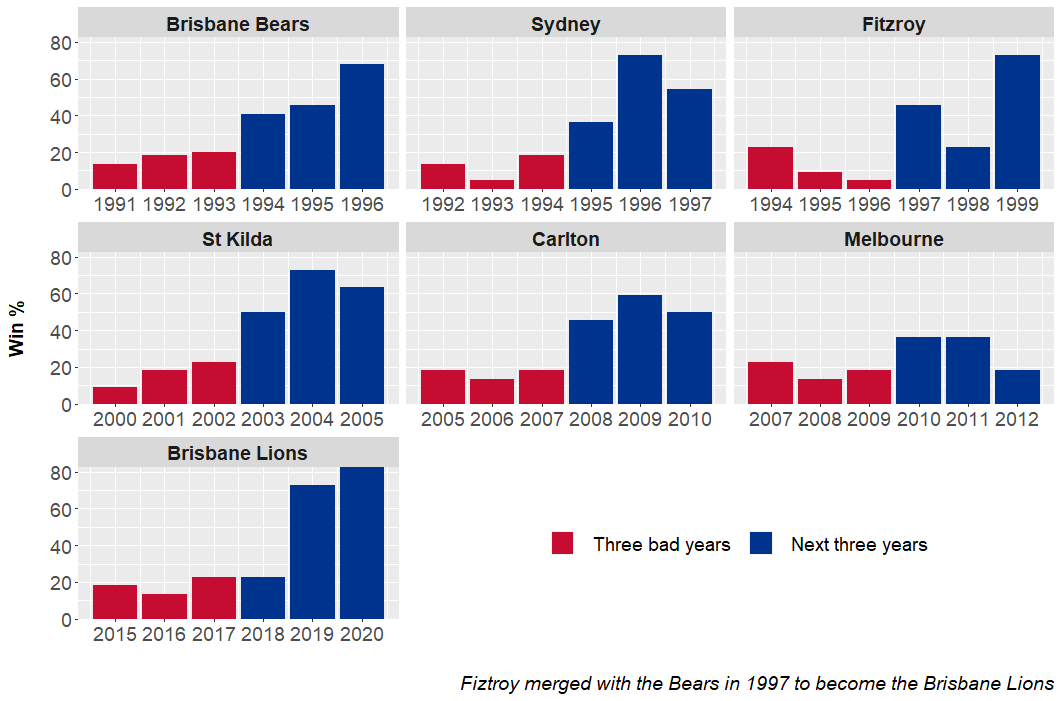
On average, teams won just 15.9% of games during their “bad” three-year period, which increased to 50.9% during the next three years. However, the results were a little mixed in terms of how much better each team got.
For example, the Bears got a little better each year from 1994-1996. In contrast, the Lions performed had the same record in 2017 and 2018, but then displayed big improvements in 2019 and 2020. Similarly, Carlton and Melbourne had smaller increases compared to St Kilda in their respective periods after three “bad” years.
An even more encouraging finding is that six of the seven teams played at least one final in the three years after the “bad” period. In fact, Sydney made the Grand Final in 1996, losing to North Melbourne.
| Team | Year | Finals? |
|---|---|---|
| Brisbane Bears | 1994 | No |
| Brisbane Bears | 1995 | Lost QF |
| Brisbane Bears | 1996 | Lost PF |
| Sydney | 1995 | No |
| Sydney | 1996 | Lost GF |
| Sydney | 1997 | Lost QF |
| Fitzroy | 1997 | Lost QF |
| Fitzroy | 1998 | No |
| Fitzroy | 1999 | Lost PF |
| St Kilda | 2003 | No |
| St Kilda | 2004 | Lost PF |
| St Kilda | 2005 | Lost PF |
| Carlton | 2008 | No |
| Carlton | 2009 | Lost EF |
| Carlton | 2010 | Lost EF |
| Melbourne | 2010 | No |
| Melbourne | 2011 | No |
| Melbourne | 2012 | No |
| Brisbane Lions | 2018 | No |
| Brisbane Lions | 2019 | Lost SF |
| Brisbane Lions | 2020 | Lost PF |
Melbourne were the only team not to play finals in their post-“bad” period. Demons fans had to wait until 2018 to see Melbourne make finals again.
North Melbourne supporters should be watching the results of next season very closely, as their team are on the closest to joining the list of seven teams from earlier in the post. After winning just three and four games in the last two seasons, the Kangaroos will need to win at least six games in 2022 (or trade away any top 5 draft picks) to stay safe.
But I suppose the encouraging thing for North Melbourne is that if they do join the list, history is on their side to jump back up the ladder (and back into finals) at some point from 2023 onwards.
(1) Notes about exclusions to the above list:
- St Kilda won less than 25% of games each year from 1984-1986, but the draft didn’t commence until 1986 (the Saints had pick 2)
- The 1990 Brisbane Bears also won less than 25% of games, but their first draft selection wasn’t until pick 10
- Melbourne had another three seasons winning less than 25% of games each year from 2012-2014, but in 2013 traded pick 2 to Greater Western Sydney as part of the Dom Tyson trade
- The 2018 Brisbane Lions won less than 25% of games and had pick 5, but traded this to Port Adelaide
(2) In statistics, the median represents the “middle” in a list of sorted numbers. For example, the median of 1, 3, 3, 6, 7, 8, and 9 is 6, as there are three numbers on either side of this value.