Disposal Efficiency and Wins
After I posted about how many times a player’s disposal efficiency has been the same as their AFL Fantasy points last week, I was contacted by one of my uncles. He works with one of my cousin’s football teams, where they have started tracking disposal efficiency over the past few weeks and was curious to know what the stats are for having a “good game” (with respect to disposal efficiency) and the outcome. Based of their experiences, my cousin’s team tend to win the quarter if they had a disposal efficiency above 60% but lost if their efficiency was below that cut off.
The AFL have recorded disposal efficiency since 2012, so these analyses are from that point onwards. During this time, teams have recorded efficiencies between 48.13% (North Melbourne against Gold Coast; Round 1, 2018) and 83.44% (Hawthorn against Carlton; Round 17, 2015). It isn’t surprising to that North Melbourne lost their game (16-point margin) and Hawthorn won theirs (138-point margin).
Interestingly, Gold Coast’s win over North in 2018 is the lowest disposal efficiency by a winning side: 51.24%. For context, the game was played at Cazaly’s Stadium (Cairns) in fairly heavy rain (you can check out the highlights here). So, I’m inclined to give them both a pass on that one. When the Hawks belted Carlton, the Blues went at 74.63% under the roof at Docklands.
Essendon has the record for the highest disposal efficiency in a loss, with 82.24% in a loss to Melbourne (Round 18, 2020). The Demons went at 77.74% in their 19-point win.
Anyway, if we group disposal efficiency into meaningfully sized groups, we can see a pretty clear pattern. Going at less than 70% disposal efficiency will win you less than four in every 10 games, while going between 70% and 75% gets you almost to a win every second game. The win rate jumps more substantially when you are over the 75% mark, and teams that have gone at over 80% efficiency have won almost 90% of their games.
Table: Disposal efficiency and wins
| Disposal efficiency | Occurences | Wins (%) |
|---|---|---|
| < 60% | 59 | 16 (27.12) |
| 60-64.9% | 179 | 62 (34.64) |
| 65-69.9% | 1006 | 377 (37.48) |
| 70-74.9% | 2253 | 1060 (47.05) |
| 75-79.9% | 1227 | 801 (65.28) |
| ≥ 80% | 80 | 69 (86.25) |
But what about when you consider the disposal efficiency of both teams? The figure below compares disposal efficiency categories for both teams. There have been 592 games where both teams had a disposal efficiency between 70-74.9%, but only two games where both teams had a disposal efficiency of 80% or more.
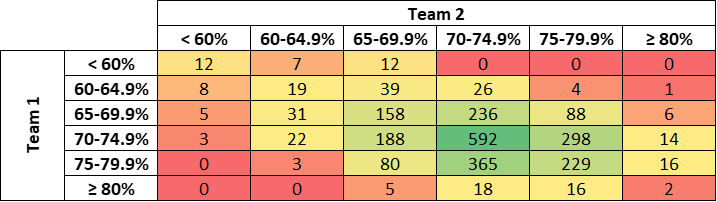
Of the 2,402 matches that have occurred between Round 1, 2012 and Round 20, 2023, the team with the higher disposal efficiency has won 68.32% of games.
As always, apologies to anyone who has already looked at this stat!